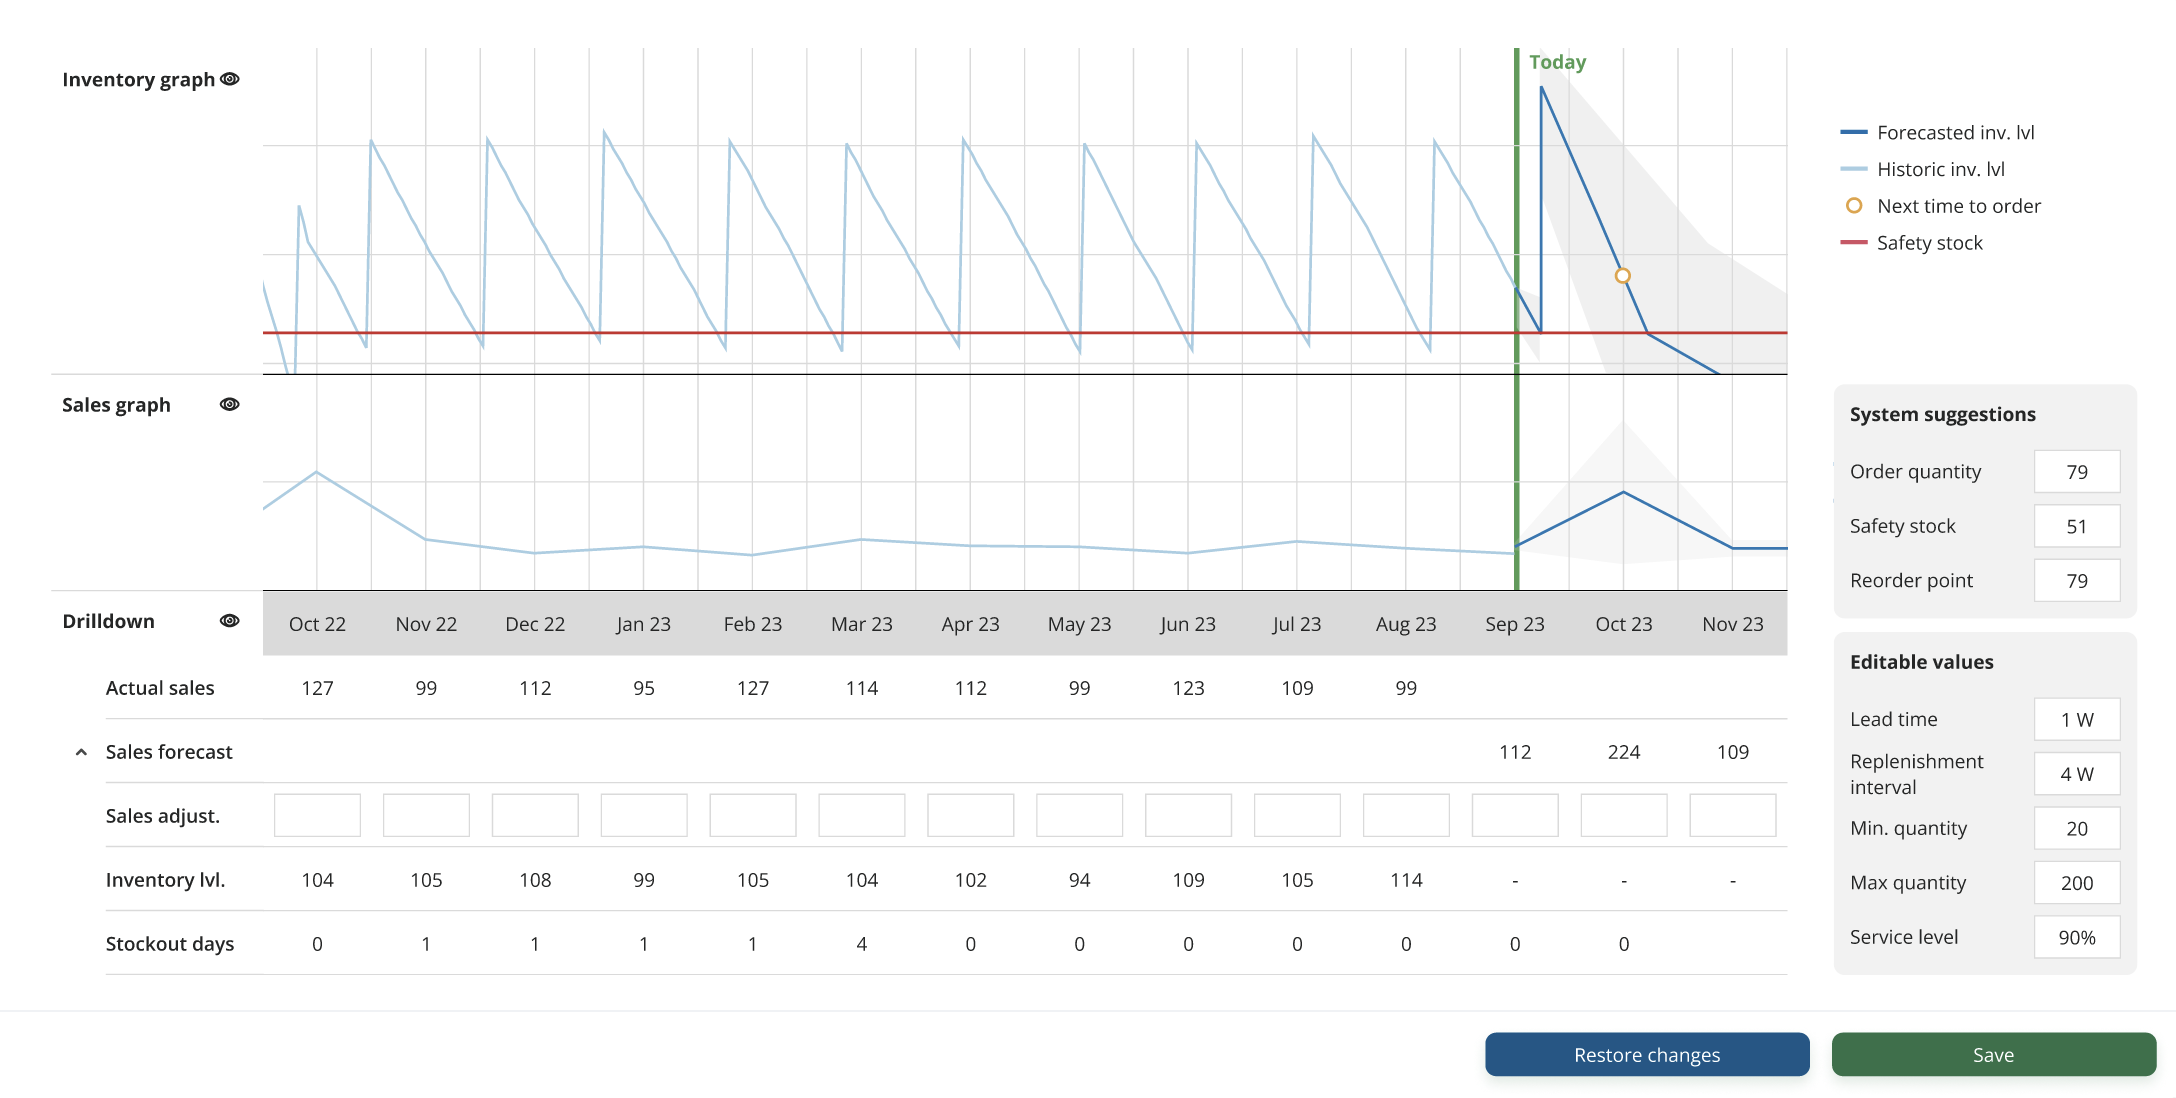
The Stock Item Screen
The examples shown in this page are for illustrative purposes only. There is lots of room for improvement to the UI/UX that these examples show. When partnering with Inventory Optimization and Resolve, we work closely together to make sure the solution fits the partner's software, requirements, and user preferences. The end result will look different from the examples shown here.
The forecast and purchase order suggestion for a stock item can be displayed in a "Stock Item Screen". Exactly how this is implemented depends on the partner's software, requirements, and user preferences, but the below is a suggestion for how it could be implemented.
The main idea of this screen is that a user can click on a product from a product overview screen, and then see all relevant information for replenishing this product in one place. The forecast and suggestions are valid from the current date, such that the user can create a purchase order from the current date. If the user wants to change any of the parameters or overwrite any of the values, she can do so. If she does, the suggestions should be recalculated in real-time. This enables the user to see the impact of her changes immediately, and do some scenario analyses before placing the purchase order.

Editable Values
This section shows the input parameters to solving the Product Replenishment Problem (PRP). The output of the PRP is a purchase order suggestion, a reorder point suggestion, and a safety stock suggestion. The input parameters that are displayed under Editable Values directly affect these, and if they're changed, the suggestions might change.
Forecast Graph
The forecast graph shows the historical demand data and the forecasted demand. Both the historical data and the forecasted data can be overwritten by the user. If the user overwrites historical data, those changes should be stored and used for future forecasts. If the user overwrites the forecasted data, the suggestions need to be updated.
Suggestions
The output of the PRP (replenishment suggestion, reorder point suggestion, and safety stock suggestion) is displayed here. The user can see the suggestions and decide whether to accept them or not. If the replenishment suggestion is accepted, that should create a purchase order in the partner's system.
Inventory Level Graph
The inventory level graph shows the historical inventory level and the forecasted inventory level. The forecasted inventory level is based on the forecasted demand, the current inventory level, and the expected deliveries and sales orders that will occur in the planning period.