Historical Data
Forecasting begins with the data. To produce a demand forecast for a stock item, Inventory Optimization requires the historical sales orders for that item. These represent the historical demand patterns for the product, and are therefore well-suited for producing demand forecasts. The terms "sales order" and "transaction" are used interchangeably, so are "stock item" and "product".
Each transaction contains five fields; transactionId, departureDate, quantity,
unitPrice, and unitCost. The first three are required. For the ABC classification to
work, the last two must also be provided. The departureDate field is the date the
product was sent to the customer from the inventory. We use the departure date as this
is the date the product actually had to be present in the inventory to meet the customer
demand. An alternative is using the date the sales order was created, but this is less
accurate in the context of purchasing, as it is the date the product was demanded from
the inventory that is relevant.
The following shows two sales orders (transactions) in a dataset.
{
    "transactions": [
        {
            "transactionId": "fe1a52de-23a1-4848-aa72-71f17741df7b",
            "departureDate": "2024-03-14",
            "quantity": 42.0,
            "unitPrice": 150.0,
            "unitCost": 72.0,
        },
        {
            "transactionId": "17284f10-d903-433e-b3fc-5ebc0b5b78c7",
            "departureDate": "2024-03-12",
            "quantity": 33.0,
            "unitPrice": 150.0,
            "unitCost": 72.0,
        },
        ...
    ]
}
Historical Sales Orders Data Schema
object Details for the webhook endpoint to call when a job finishes | |
required | Array of objects (Raw Data Upload Request Datasets) non-empty The datasets containing raw data for the sales trainer |
{- "webhook": {
- "webhookUrl": "string",
- "webhookApiKey": "string"
}, - "datasets": [
- {
- "datasetId": "string",
- "transactions": [
- {
- "transactionId": "string",
- "departureDate": "string",
- "quantity": 0,
- "unitPrice": 0,
- "unitCost": 0
}
]
}
]
}Upload and Storage
When data is uploaded to Inventory Optimization, it is aggregated on a daily granularity before it is stored. This means that partners can upload all unique sales orders without doing any aggregation on their side. But, note that it is required that each transaction is unique, with a unique transaction ID. If a transaction is uploaded with the same ID as a previously uploaded transaction, the new transaction will overwrite the old one.
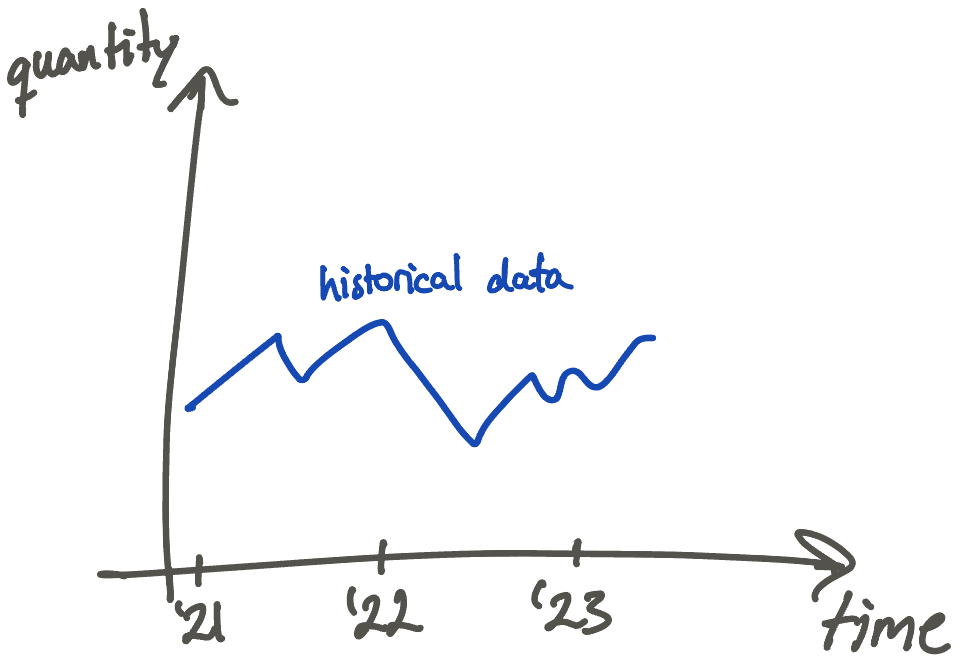
Visualization
To visualize the historical data for a stock item, referred to as a dataset, we can plot departureDate on the x-axis and quantity on the y-axis to get a time series. An example of such a time series is shown below.
While the core value proposition of Inventory Optimization lies in the demand forecasts and the purchase order suggestions, the value of just empowering users with visualizing the historical data is also significant. In many cases, this is not readily available for purchasers to inspect. Very often, they would like to know "how many paper clips did I sell in April last year?", and visualizing the historical data in smart ways helps users get this type of insight.